

Online courses directory (13677)

Learn how to reach out and build genuine relationships with reporters, journalists, and press.

Build Your Sales Process with the Sales Model Canvas

Build Your Sales Process with the Sales Model Canvas

How to focus on customers, their activities and the context where those take place for better product & idea development

Mixergy produced the "Lean Launch Guide" below. We thought this was such a good resource that we included it in Startup

"Preço em dólar, para comprar em reais acesse o Portal Endeavor"

Are You Afraid to Start your Startup: Grab the Frameworks You Need to Succeed as a Startup Entrepreneur and Get Going!

Frank Levinson, founder of Finisar, begins his talk with a story about a failed startup of his, Netek. Netek is an examp

An add-on series for the E-commerce course explaining how to improve the SEO of our on-line store.

Statistical Reasoning introduces students to the basic concepts and logic of statistical reasoning and gives the students introductory-level practical ability to choose, generate, and properly interpret appropriate descriptive and inferential methods. In addition, the course helps students gain an appreciation for the diverse applications of statistics and its relevance to their lives and fields of study. The course does not assume any prior knowledge in statistics and its only prerequisite is basic algebra. We offer two versions of statistics, each with a different emphasis: Probability and Statistics and Statistical Reasoning. Each course includes all expository text, simulations, case studies, comprehension tests, interactive learning exercises, and the StatTutor labs. Each course contains all of the instructions for the four statistics packages options we support. To do the activities, you will need your own copy of Microsoft Excel, Minitab, the open source R software, TI calculator, or StatCrunch. One of the main differences between the courses is the path through probability; Statistical Reasoning places less emphasis on probability than does the Probability and Statistics course and takes an empirical approach.

We live in a time of unprecedented access to information. You'll learn how to use statistics to interpret that information and make decisions. San Jose State University
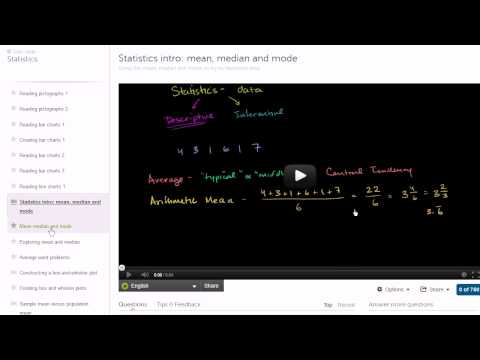
Introduction to statistics. We start with the basics of reading and interpretting data and then build into descriptive and inferential statistics that are typically covered in an introductory course on the subject. Overview of Khan Academy statistics. Statistics intro: mean, median and mode. Constructing a box-and-whisker plot. Sample mean versus population mean.. Variance of a population. Sample variance. Review and intuition why we divide by n-1 for the unbiased sample variance. Simulation showing bias in sample variance. Simulation providing evidence that (n-1) gives us unbiased estimate. Statistics: Standard Deviation. Statistics: Alternate Variance Formulas. Introduction to Random Variables. Probability Density Functions. Binomial Distribution 1. Binomial Distribution 2. Binomial Distribution 3. Binomial Distribution 4. Expected Value: E(X). Expected Value of Binomial Distribution. Poisson Process 1. Poisson Process 2. Introduction to the Normal Distribution. Normal Distribution Excel Exercise. Law of Large Numbers. ck12.org Normal Distribution Problems: Qualitative sense of normal distributions. ck12.org Normal Distribution Problems: Empirical Rule. ck12.org Normal Distribution Problems: z-score. ck12.org Exercise: Standard Normal Distribution and the Empirical Rule. ck12.org: More Empirical Rule and Z-score practice. Central Limit Theorem. Sampling Distribution of the Sample Mean. Sampling Distribution of the Sample Mean 2. Standard Error of the Mean. Sampling Distribution Example Problem. Confidence Interval 1. Confidence Interval Example. Mean and Variance of Bernoulli Distribution Example. Bernoulli Distribution Mean and Variance Formulas. Margin of Error 1. Margin of Error 2. Small Sample Size Confidence Intervals. Hypothesis Testing and P-values. One-Tailed and Two-Tailed Tests. Z-statistics vs. T-statistics. Type 1 Errors. Small Sample Hypothesis Test. T-Statistic Confidence Interval. Large Sample Proportion Hypothesis Testing. Variance of Differences of Random Variables. Difference of Sample Means Distribution. Confidence Interval of Difference of Means. Clarification of Confidence Interval of Difference of Means. Hypothesis Test for Difference of Means. Comparing Population Proportions 1. Comparing Population Proportions 2. Hypothesis Test Comparing Population Proportions. Squared Error of Regression Line. Proof (Part 1) Minimizing Squared Error to Regression Line. Proof Part 2 Minimizing Squared Error to Line. Proof (Part 3) Minimizing Squared Error to Regression Line. Proof (Part 4) Minimizing Squared Error to Regression Line. Regression Line Example. Second Regression Example. R-Squared or Coefficient of Determination. Calculating R-Squared. Covariance and the Regression Line. Correlation and Causality. Chi-Square Distribution Introduction. Pearson's Chi Square Test (Goodness of Fit). Contingency Table Chi-Square Test. ANOVA 1 - Calculating SST (Total Sum of Squares). ANOVA 2 - Calculating SSW and SSB (Total Sum of Squares Within and Between).avi. ANOVA 3 -Hypothesis Test with F-Statistic. Another simulation giving evidence that (n-1) gives us an unbiased estimate of variance. Mean Median and Mode. Range and Mid-range. Reading Pictographs. Reading Bar Graphs. Reading Line Graphs. Reading Pie Graphs (Circle Graphs). Misleading Line Graphs. Stem-and-leaf Plots. Box-and-Whisker Plots. Reading Box-and-Whisker Plots. Statistics: The Average. Statistics: Variance of a Population. Statistics: Sample Variance. Deductive Reasoning 1. Deductive Reasoning 2. Deductive Reasoning 3. Inductive Reasoning 1. Inductive Reasoning 2. Inductive Reasoning 3. Inductive Patterns.

Introduction to statistics. Will eventually cover all of the major topics in a first-year statistics course.

Whether you'd like a refresher on the differences between descriptive and inferential statistics or are looking to hone your ability to analyze residuals, this course's video lessons have got you covered. Instructors discuss topics ranging from sample variance and box plots to conditional probabilities and z-scores. Areas of study addressed in this course include:
Statistics is the science that turns data into information and information into knowledge. This class covers applied statistical methodology from an analysis-of-data viewpoint. Topics covered include frequency distributions; measures of location; mean, median, mode; measures of dispersion; variance; graphic presentation; elementary probability; populations and samples; sampling distributions; one sample univariate inference problems, and two sample problems; categorical data; regression and correlation; and analysis of variance. Use of computers in data analysis is also explored. This course contains the Winter 2013 Statistics 250 Workbook and Interactive Lecture Notes. Fall 2011 Statistics 250 materials (syllabus, lectures, and workbooks) are also available for download. Course Level: Undergraduate This Work, Statistics 250 - Introduction to Statistics and Data Analysis, by Brenda Gunderson is licensed under a Creative Commons Attribution-NonCommercial-ShareAlike license.

This free online course is the first of our Upper-Secondary Mathematics suite of courses. It covers mathematical analysis, including univariate statistics and data, bivariate statistics, correlation, regression, residual analysis, non-linear data, and seasonal movements. This course is suitable for students of maths, especially those preparing for examinations. It is also suitable for those looking to refresh their knowledge of Mathematics. <br />

If you keep more than a screen shot of email in your inbox, you need this program!

Yahoo is a very popular Web site but, with strong competition for products and services coming from others like Google and Facebook, Yahoo as an organisation faces severe challenges in being more competitive in the advertising market. In this free online course Sue Decker, the CEO of Yahoo from 2008 to 2009, discusses how the founders of Yahoo focused on the needs of its customers by developing a hierarchal database structure for faster and more efficient searches making life easier for the customer. The course also looks at how internal structuring of the sales force was implemented to improve customer service, where the gap in monetising search queries between it and Google occurred, and recent acquisition proposals. This course will be of interest to advertising, business, marketing professionals and entrepreneurs who have an interest in how an online Web company uses its customer base as a business model.<br />

Learn how to keep the bad guys away while you're on and off the internet.

How to Say No Assertively And Protect Your Personal Boundaries
Add to calendar

Trusted paper writing service WriteMyPaper.Today will write the papers of any difficulty.