

Online courses directory (19947)
This tutorial is the meat of much of classical physics. We think about what a force is and how Newton changed the world's (and possibly your) view of how reality works. Newton's First Law of Motion. Newton's First Law of Motion Concepts. Newton's First Law of Motion. Newton's First Law. Newton's Second Law of Motion. Newton's Third Law of Motion. Newton's Third Law of Motion. All of Newton's Laws of Motion. Normal Force and Contact Force. Normal Force in an Elevator. Balanced and Unbalanced Forces. Unbalanced Forces and Motion. Slow Sock on Lubricon VI. Normal Forces on Lubricon VI. Inclined Plane Force Components. Ice Accelerating Down an Incline. Force of Friction Keeping the Block Stationary. Correction to Force of Friction Keeping the Block Stationary. Force of Friction Keeping Velocity Constant. Intuition on Static and Kinetic Friction Comparisons. Static and Kinetic Friction Example. Introduction to Tension. Introduction to Tension (Part 2). Tension in an accelerating system and pie in the face. Newton's First Law of Motion. Newton's First Law of Motion Concepts. Newton's First Law of Motion. Newton's First Law. Newton's Second Law of Motion. Newton's Third Law of Motion. Newton's Third Law of Motion. All of Newton's Laws of Motion. Normal Force and Contact Force. Normal Force in an Elevator. Balanced and Unbalanced Forces. Unbalanced Forces and Motion. Slow Sock on Lubricon VI. Normal Forces on Lubricon VI. Inclined Plane Force Components. Ice Accelerating Down an Incline. Force of Friction Keeping the Block Stationary. Correction to Force of Friction Keeping the Block Stationary. Force of Friction Keeping Velocity Constant. Intuition on Static and Kinetic Friction Comparisons. Static and Kinetic Friction Example. Introduction to Tension. Introduction to Tension (Part 2). Tension in an accelerating system and pie in the face.
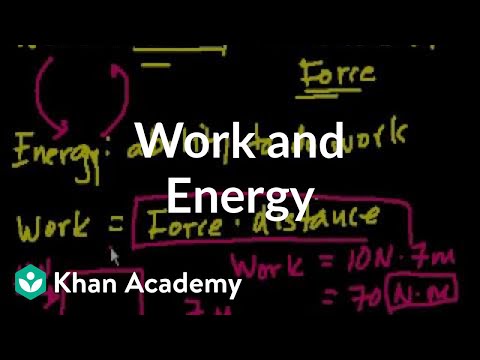
Work and energy. Potential energy. Kinetic energy. Mechanical advantage. Springs and Hooke's law. Introduction to work and energy. Work and Energy (part 2). Conservation of Energy. Work/Energy problem with Friction. Introduction to mechanical advantage. Mechanical Advantage (part 2). Mechanical Advantage (part 3). Intro to springs and Hooke's Law. Potential energy stored in a spring. Spring potential energy example (mistake in math). Introduction to work and energy. Work and Energy (part 2). Conservation of Energy. Work/Energy problem with Friction. Introduction to mechanical advantage. Mechanical Advantage (part 2). Mechanical Advantage (part 3). Intro to springs and Hooke's Law. Potential energy stored in a spring. Spring potential energy example (mistake in math).

Classical gravity. How masses attract each other (according to Newton). Introduction to Gravity. Mass and Weight Clarification. Gravity for Astronauts in Orbit. Would a Brick or Feather Fall Faster. Acceleration Due to Gravity at the Space Station. Space Station Speed in Orbit. Introduction to Newton's Law of Gravitation. Gravitation (part 2). Introduction to Gravity. Mass and Weight Clarification. Gravity for Astronauts in Orbit. Would a Brick or Feather Fall Faster. Acceleration Due to Gravity at the Space Station. Space Station Speed in Orbit. Introduction to Newton's Law of Gravitation. Gravitation (part 2).
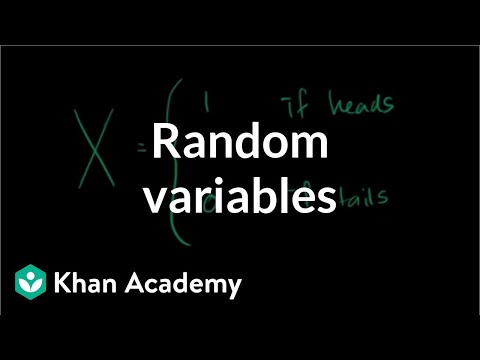
Introduction to probability. Independent and dependent events. Compound events. Mutual exclusive events. Addition rule for probability. Basic Probability. Probability space exercise example. Probability space. Example: Marbles from a bag. Example: Picking a non-blue marble. Example: Picking a yellow marble. Probability 1. Probability with Playing Cards and Venn Diagrams. Addition Rule for Probability. Compound Probability of Independent Events. Getting At Least One Heads. Example: Probability of rolling doubles. LeBron Asks: What are the chances of making 10 free throws in a row?. LeBron Asks: What are the chances of three free throws versus one three pointer?. Frequency Probability and Unfair Coins. Example: Getting two questions right on an exam. Example: Rolling even three times. Independent probability. Frequency Stability. Introduction to dependent probability. Example: Dependent probability. Example: Is an event independent or dependent?. Example: Bag of unfair coins. Dependent probability. Monty Hall Problem. Intersection and union of sets. Relative complement or difference between sets. Universal set and absolute complement. Subset, strict subset, and superset. Bringing the set operations together. Basic set notation. Probability (part 1). Probability (part 2). Probability (part 3). Probability (part 4). Probability (part 5). Probability (part 6). Probability (part 7). Probability (part 8). Introduction to Random Variables. Basic Probability. Probability space exercise example. Probability space. Example: Marbles from a bag. Example: Picking a non-blue marble. Example: Picking a yellow marble. Probability 1. Probability with Playing Cards and Venn Diagrams. Addition Rule for Probability. Compound Probability of Independent Events. Getting At Least One Heads. Example: Probability of rolling doubles. LeBron Asks: What are the chances of making 10 free throws in a row?. LeBron Asks: What are the chances of three free throws versus one three pointer?. Frequency Probability and Unfair Coins. Example: Getting two questions right on an exam. Example: Rolling even three times. Independent probability. Frequency Stability. Introduction to dependent probability. Example: Dependent probability. Example: Is an event independent or dependent?. Example: Bag of unfair coins. Dependent probability. Monty Hall Problem. Intersection and union of sets. Relative complement or difference between sets. Universal set and absolute complement. Subset, strict subset, and superset. Bringing the set operations together. Basic set notation. Probability (part 1). Probability (part 2). Probability (part 3). Probability (part 4). Probability (part 5). Probability (part 6). Probability (part 7). Probability (part 8). Introduction to Random Variables.
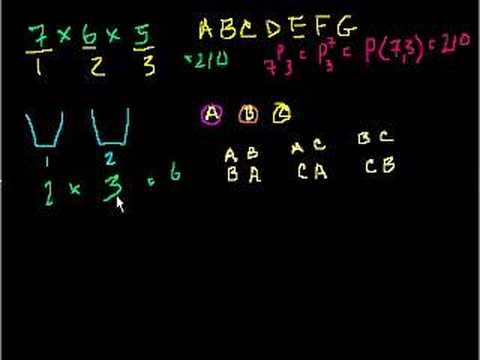
Permutations and combinations. Using combinatorics to solve questions in probability. Permutations. Combinations. Counting 2. Example: Ways to arrange colors. Example: 9 card hands. Example: Ways to pick officers. Permutations. Combinations. Permutations and combinations. Example: Probability through counting outcomes. Example: All the ways you can flip a coin. Getting Exactly Two Heads (Combinatorics). Probability and Combinations (part 2). Probability using Combinations. Exactly Three Heads in Five Flips. Example: Different ways to pick officers. Example: Combinatorics and probability. Example: Lottery probability. Mega Millions Jackpot Probability. Generalizing with Binomial Coefficients (bit advanced). Conditional Probability and Combinations. Conditional Probability (Bayes Theorem) Visualized. Birthday Probability Problem. Probability with permutations and combinations. Permutations. Combinations. Counting 2. Example: Ways to arrange colors. Example: 9 card hands. Example: Ways to pick officers. Permutations. Combinations. Permutations and combinations. Example: Probability through counting outcomes. Example: All the ways you can flip a coin. Getting Exactly Two Heads (Combinatorics). Probability and Combinations (part 2). Probability using Combinations. Exactly Three Heads in Five Flips. Example: Different ways to pick officers. Example: Combinatorics and probability. Example: Lottery probability. Mega Millions Jackpot Probability. Generalizing with Binomial Coefficients (bit advanced). Conditional Probability and Combinations. Conditional Probability (Bayes Theorem) Visualized. Birthday Probability Problem. Probability with permutations and combinations.
Random variables. Expected value. Probability distributions (both discrete and continuous). Binomial distribution. Poisson processes. Random Variables. Discrete and continuous random variables. Probability Density Functions. Expected Value: E(X). Expected value. Law of Large Numbers. Term Life Insurance and Death Probability. Binomial Distribution 1. Binomial Distribution 2. Binomial Distribution 3. Binomial Distribution 4. Expected Value of Binomial Distribution. Galton Board Exploration. Poisson Process 1. Poisson Process 2. Random Variables. Discrete and continuous random variables. Probability Density Functions. Expected Value: E(X). Expected value. Law of Large Numbers. Term Life Insurance and Death Probability. Binomial Distribution 1. Binomial Distribution 2. Binomial Distribution 3. Binomial Distribution 4. Expected Value of Binomial Distribution. Galton Board Exploration. Poisson Process 1. Poisson Process 2.

Measures of central tendency and dispersion. Mean, median, mode, variance, and standard deviation. Statistics intro: mean, median and mode. Example: Finding mean, median and mode. Mean median and mode. Exploring Mean and Median Module. Exploring mean and median. Average word problems. Sample mean versus population mean.. Reading Box-and-Whisker Plots. Constructing a box-and-whisker plot. Box-and-Whisker Plots. Creating box and whisker plots. Example: Range and mid-range. Range, Variance and Standard Deviation as Measures of Dispersion. Variance of a population. Sample variance. Review and intuition why we divide by n-1 for the unbiased sample variance. Simulation showing bias in sample variance. Unbiased Estimate of Population Variance. Another simulation giving evidence that (n-1) gives us an unbiased estimate of variance. Simulation providing evidence that (n-1) gives us unbiased estimate. Will it converge towards -1?. Variance. Population standard deviation. Sample standard deviation and bias. Statistics: Standard Deviation. Exploring Standard Deviation 1 Module. Exploring standard deviation 1. Standard deviation. Statistics: Alternate Variance Formulas. Statistics: The Average. Statistics: Variance of a Population. Statistics: Sample Variance. Statistics intro: mean, median and mode. Example: Finding mean, median and mode. Mean median and mode. Exploring Mean and Median Module. Exploring mean and median. Average word problems. Sample mean versus population mean.. Reading Box-and-Whisker Plots. Constructing a box-and-whisker plot. Box-and-Whisker Plots. Creating box and whisker plots. Example: Range and mid-range. Range, Variance and Standard Deviation as Measures of Dispersion. Variance of a population. Sample variance. Review and intuition why we divide by n-1 for the unbiased sample variance. Simulation showing bias in sample variance. Unbiased Estimate of Population Variance. Another simulation giving evidence that (n-1) gives us an unbiased estimate of variance. Simulation providing evidence that (n-1) gives us unbiased estimate. Will it converge towards -1?. Variance. Population standard deviation. Sample standard deviation and bias. Statistics: Standard Deviation. Exploring Standard Deviation 1 Module. Exploring standard deviation 1. Standard deviation. Statistics: Alternate Variance Formulas. Statistics: The Average. Statistics: Variance of a Population. Statistics: Sample Variance.

Lecture Series on Design & Analysis of Algorithms by Prof.Abhiram Ranade, Department of Computer Science Engineering

Learn how to begin with Sencha Touch 2. See how to build a Application to show Home Screen and List Google Places.
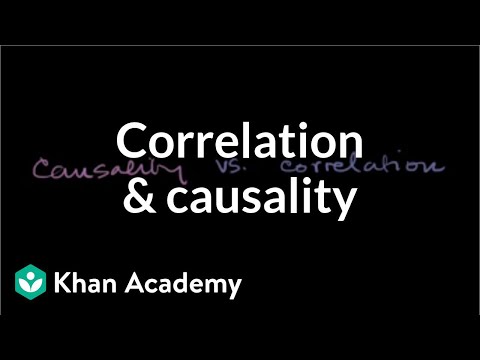
Fitting a line to points. Linear regression. R-squared. Correlation and Causality. Fitting a Line to Data. Estimating the line of best fit exercise. Estimating the line of best fit. Squared Error of Regression Line. Proof (Part 1) Minimizing Squared Error to Regression Line. Proof Part 2 Minimizing Squared Error to Line. Proof (Part 3) Minimizing Squared Error to Regression Line. Proof (Part 4) Minimizing Squared Error to Regression Line. Regression Line Example. Second Regression Example. R-Squared or Coefficient of Determination. Calculating R-Squared. Covariance and the Regression Line. Correlation and Causality. Fitting a Line to Data. Estimating the line of best fit exercise. Estimating the line of best fit. Squared Error of Regression Line. Proof (Part 1) Minimizing Squared Error to Regression Line. Proof Part 2 Minimizing Squared Error to Line. Proof (Part 3) Minimizing Squared Error to Regression Line. Proof (Part 4) Minimizing Squared Error to Regression Line. Regression Line Example. Second Regression Example. R-Squared or Coefficient of Determination. Calculating R-Squared. Covariance and the Regression Line.
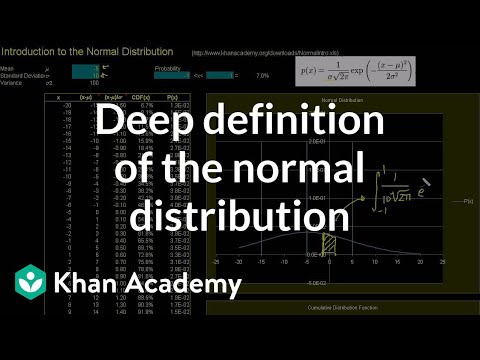
Making inferences based on sample data. Confidence intervals. Margin of error. Hypothesis testing. Introduction to the Normal Distribution. Normal Distribution Excel Exercise. ck12.org Normal Distribution Problems: Qualitative sense of normal distributions. ck12.org Normal Distribution Problems: Empirical Rule. ck12.org Normal Distribution Problems: z-score. ck12.org Exercise: Standard Normal Distribution and the Empirical Rule. Empirical rule. ck12.org: More Empirical Rule and Z-score practice. Z scores 1. Z scores 2. Z scores 3. Central Limit Theorem. Sampling Distribution of the Sample Mean. Sampling Distribution of the Sample Mean 2. Standard Error of the Mean. Sampling Distribution Example Problem. Confidence Interval 1. Confidence Interval Example. Small Sample Size Confidence Intervals. Mean and Variance of Bernoulli Distribution Example. Bernoulli Distribution Mean and Variance Formulas. Margin of Error 1. Margin of Error 2. Hypothesis Testing and P-values. One-Tailed and Two-Tailed Tests. Type 1 Errors. Z-statistics vs. T-statistics. Small Sample Hypothesis Test. T-Statistic Confidence Interval. Large Sample Proportion Hypothesis Testing. Variance of Differences of Random Variables. Difference of Sample Means Distribution. Confidence Interval of Difference of Means. Clarification of Confidence Interval of Difference of Means. Hypothesis Test for Difference of Means. Comparing Population Proportions 1. Comparing Population Proportions 2. Hypothesis Test Comparing Population Proportions. Chi-Square Distribution Introduction. Pearson's Chi Square Test (Goodness of Fit). Contingency Table Chi-Square Test. ANOVA 1 - Calculating SST (Total Sum of Squares). ANOVA 2 - Calculating SSW and SSB (Total Sum of Squares Within and Between).avi. ANOVA 3 -Hypothesis Test with F-Statistic. Introduction to the Normal Distribution. Normal Distribution Excel Exercise. ck12.org Normal Distribution Problems: Qualitative sense of normal distributions. ck12.org Normal Distribution Problems: Empirical Rule. ck12.org Normal Distribution Problems: z-score. ck12.org Exercise: Standard Normal Distribution and the Empirical Rule. Empirical rule. ck12.org: More Empirical Rule and Z-score practice. Z scores 1. Z scores 2. Z scores 3. Central Limit Theorem. Sampling Distribution of the Sample Mean. Sampling Distribution of the Sample Mean 2. Standard Error of the Mean. Sampling Distribution Example Problem. Confidence Interval 1. Confidence Interval Example. Small Sample Size Confidence Intervals. Mean and Variance of Bernoulli Distribution Example. Bernoulli Distribution Mean and Variance Formulas. Margin of Error 1. Margin of Error 2. Hypothesis Testing and P-values. One-Tailed and Two-Tailed Tests. Type 1 Errors. Z-statistics vs. T-statistics. Small Sample Hypothesis Test. T-Statistic Confidence Interval. Large Sample Proportion Hypothesis Testing. Variance of Differences of Random Variables. Difference of Sample Means Distribution. Confidence Interval of Difference of Means. Clarification of Confidence Interval of Difference of Means. Hypothesis Test for Difference of Means. Comparing Population Proportions 1. Comparing Population Proportions 2. Hypothesis Test Comparing Population Proportions. Chi-Square Distribution Introduction. Pearson's Chi Square Test (Goodness of Fit). Contingency Table Chi-Square Test. ANOVA 1 - Calculating SST (Total Sum of Squares). ANOVA 2 - Calculating SSW and SSB (Total Sum of Squares Within and Between).avi. ANOVA 3 -Hypothesis Test with F-Statistic.

Conversion Rate Optimization - How To Make More Money From The Traffic You Already Get

Lecture Series on Programming Languages by Dr.S.Arun Kumar, Department of Computer Science & Engineering ,IIT Delhi.

Lectures by Dr.Sukhendu Das, rnDept. of Computer Science and Engineering, rnIIT Madras

Lecture Series on Computer Architecture by Prof. Anshul Kumar, Department of Computer Science & Engineering ,IIT Del

Lecture Series on Artificial Intelligence by Prof.Sudeshna Sarkar and Prof.Anupam Basu, Department of Computer Science &
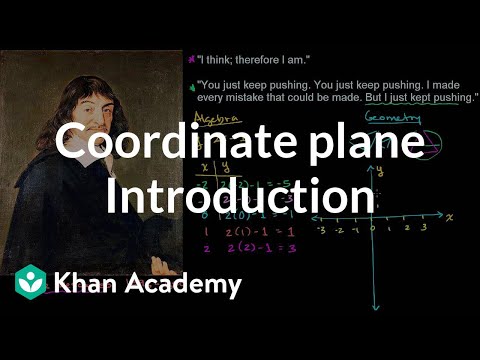
Thinking about graphing on a coordinate plane, slope and other analytic geometry. Descartes and Cartesian Coordinates. The Coordinate Plane. Plot ordered pairs. Graphing points. Quadrants of Coordinate Plane. Graphing points and naming quadrants. Points on the coordinate plane. Ordered pair solutions of equations. Ordered Pair Solutions of Equations 2. Ordered pair solutions to linear equations. Recognizing Linear Functions. Interpreting linear relationships. Slope of a line. Slope of a Line 2. Slope and Rate of Change. Graphical Slope of a Line. Slope of a Line 3. Identifying slope of a line. Slope and Y-intercept Intuition. Line graph intuition. Graphing a line in slope intercept form. Converting to slope-intercept form. Graphing linear equations. Multiple examples of constructing linear equations in slope-intercept form. Constructing equations in slope-intercept form from graphs. Constructing linear equations to solve word problems. Linear equation from slope and a point. Finding a linear equation given a point and slope. Constructing the equation of a line given two points. Solving for the y-intercept. Slope intercept form. Linear Equations in Point Slope Form. Point slope form. Linear Equations in Standard Form. Point-slope and standard form. Converting between slope-intercept and standard form. Converting between point-slope and slope-intercept. Finding the equation of a line. Midpoint formula. Midpoint formula. Distance Formula. Distance formula. Perpendicular Line Slope. Equations of Parallel and Perpendicular Lines. Parallel Line Equation. Parallel Lines. Parallel Lines 2. Parallel lines 3. Perpendicular Lines. Perpendicular lines 2. Equations of parallel and perpendicular lines. Distance between point and line. Graphing Inequalities. Solving and graphing linear inequalities in two variables 1. Graphing Linear Inequalities in Two Variables Example 2. Graphing Inequalities 2. Graphing linear inequalities in two variables 3. Graphs of inequalities. Graphing linear inequalities. Graphing and solving linear inequalities. Descartes and Cartesian Coordinates. The Coordinate Plane. Plot ordered pairs. Graphing points. Quadrants of Coordinate Plane. Graphing points and naming quadrants. Points on the coordinate plane. Ordered pair solutions of equations. Ordered Pair Solutions of Equations 2. Ordered pair solutions to linear equations. Recognizing Linear Functions. Interpreting linear relationships. Slope of a line. Slope of a Line 2. Slope and Rate of Change. Graphical Slope of a Line. Slope of a Line 3. Identifying slope of a line. Slope and Y-intercept Intuition. Line graph intuition. Graphing a line in slope intercept form. Converting to slope-intercept form. Graphing linear equations. Multiple examples of constructing linear equations in slope-intercept form. Constructing equations in slope-intercept form from graphs. Constructing linear equations to solve word problems. Linear equation from slope and a point. Finding a linear equation given a point and slope. Constructing the equation of a line given two points. Solving for the y-intercept. Slope intercept form. Linear Equations in Point Slope Form. Point slope form. Linear Equations in Standard Form. Point-slope and standard form. Converting between slope-intercept and standard form. Converting between point-slope and slope-intercept. Finding the equation of a line. Midpoint formula. Midpoint formula. Distance Formula. Distance formula. Perpendicular Line Slope. Equations of Parallel and Perpendicular Lines. Parallel Line Equation. Parallel Lines. Parallel Lines 2. Parallel lines 3. Perpendicular Lines. Perpendicular lines 2. Equations of parallel and perpendicular lines. Distance between point and line. Graphing Inequalities. Solving and graphing linear inequalities in two variables 1. Graphing Linear Inequalities in Two Variables Example 2. Graphing Inequalities 2. Graphing linear inequalities in two variables 3. Graphs of inequalities. Graphing linear inequalities. Graphing and solving linear inequalities.
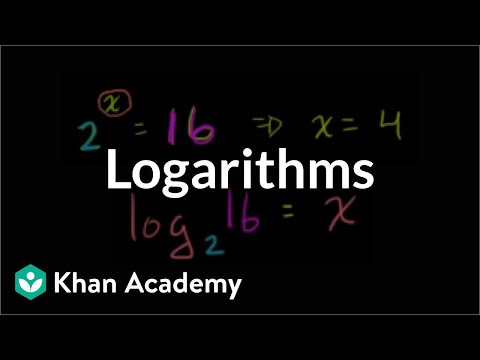
Logarithms. Ex: Converting an exponential to logarithmic statement. Evaluating logarithms. Fancier logarithm expressions. Evaluating logarithms 2. Graphing Logarithmic Functions. Introduction to Logarithms. Introduction to logarithm properties. Introduction to logarithm properties (part 2). Logarithm of a Power. Sum of Logarithms with Same Base. Using Multiple Logarithm Properties to Simplify. Operations with logarithms. Change of Base Formula. Proof: log a + log b = log ab. Proof: A(log B) = log (B^A), log A - log B = log (A/B). Change of base formula proof. Logarithmic Equations. Solving Logarithmic Equations. Solving Logarithmic Equations. Logarithmic Scale. Richter Scale. Natural Logarithm with a Calculator. Calculator for Natural Logarithms. Graphing Natural Logarithm Function. Logarithms. Ex: Converting an exponential to logarithmic statement. Evaluating logarithms. Fancier logarithm expressions. Evaluating logarithms 2. Graphing Logarithmic Functions. Introduction to Logarithms. Introduction to logarithm properties. Introduction to logarithm properties (part 2). Logarithm of a Power. Sum of Logarithms with Same Base. Using Multiple Logarithm Properties to Simplify. Operations with logarithms. Change of Base Formula. Proof: log a + log b = log ab. Proof: A(log B) = log (B^A), log A - log B = log (A/B). Change of base formula proof. Logarithmic Equations. Solving Logarithmic Equations. Solving Logarithmic Equations. Logarithmic Scale. Richter Scale. Natural Logarithm with a Calculator. Calculator for Natural Logarithms. Graphing Natural Logarithm Function.

Lectures by Prof. Kamala Krithivasan,rnDepartment of Computer Science and Engineering,rnIIT Madras

We will create a MySQL database, setup a web page that connects to the database, retrieves data, & manipulates data.
Add to calendar

Trusted paper writing service WriteMyPaper.Today will write the papers of any difficulty.