

Courses tagged with "Navigation+SAP" (294)

The foundations of basic probability.

Problemler konu anlatımları 2. Havuz, Karışım, Hareket ve Faiz Problemleri

Introductions and Pretest Chapter 1 - Introduction to Specifications (Randy) Chapter 2 - Professionalism (Randy) Chapter

This Stanford Continuing Studies course is the first of a three-quarter sequence of classes exploring "quantum enta

This Stanford Continuing Studies course is the third of a three-quarter sequence of classes exploring "quantum enta
This is an introduction to quantum computation, a cutting edge field that tries to exploit the exponential power of computers based on quantum mechanics. The course does not assume any prior background in quantum mechanics, and can be viewed as a very simple and conceptual introduction to that field.


Become an expert in 'Real Numbers' by having a thorough understanding of the topic

Sample problems from SingaporeMath.com.

Bu dersle sıralama ve basit eşitsizliklerle ilgili tüm bilmeniz gerekenleri öğreneceksiniz
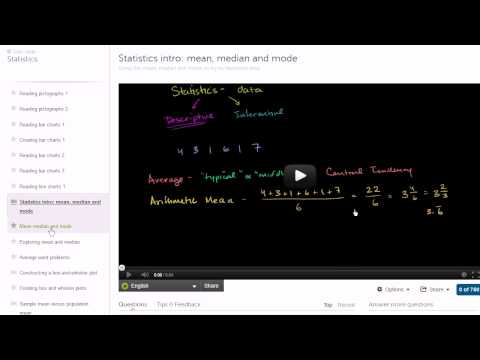
Introduction to statistics. We start with the basics of reading and interpretting data and then build into descriptive and inferential statistics that are typically covered in an introductory course on the subject. Overview of Khan Academy statistics. Statistics intro: mean, median and mode. Constructing a box-and-whisker plot. Sample mean versus population mean.. Variance of a population. Sample variance. Review and intuition why we divide by n-1 for the unbiased sample variance. Simulation showing bias in sample variance. Simulation providing evidence that (n-1) gives us unbiased estimate. Statistics: Standard Deviation. Statistics: Alternate Variance Formulas. Introduction to Random Variables. Probability Density Functions. Binomial Distribution 1. Binomial Distribution 2. Binomial Distribution 3. Binomial Distribution 4. Expected Value: E(X). Expected Value of Binomial Distribution. Poisson Process 1. Poisson Process 2. Introduction to the Normal Distribution. Normal Distribution Excel Exercise. Law of Large Numbers. ck12.org Normal Distribution Problems: Qualitative sense of normal distributions. ck12.org Normal Distribution Problems: Empirical Rule. ck12.org Normal Distribution Problems: z-score. ck12.org Exercise: Standard Normal Distribution and the Empirical Rule. ck12.org: More Empirical Rule and Z-score practice. Central Limit Theorem. Sampling Distribution of the Sample Mean. Sampling Distribution of the Sample Mean 2. Standard Error of the Mean. Sampling Distribution Example Problem. Confidence Interval 1. Confidence Interval Example. Mean and Variance of Bernoulli Distribution Example. Bernoulli Distribution Mean and Variance Formulas. Margin of Error 1. Margin of Error 2. Small Sample Size Confidence Intervals. Hypothesis Testing and P-values. One-Tailed and Two-Tailed Tests. Z-statistics vs. T-statistics. Type 1 Errors. Small Sample Hypothesis Test. T-Statistic Confidence Interval. Large Sample Proportion Hypothesis Testing. Variance of Differences of Random Variables. Difference of Sample Means Distribution. Confidence Interval of Difference of Means. Clarification of Confidence Interval of Difference of Means. Hypothesis Test for Difference of Means. Comparing Population Proportions 1. Comparing Population Proportions 2. Hypothesis Test Comparing Population Proportions. Squared Error of Regression Line. Proof (Part 1) Minimizing Squared Error to Regression Line. Proof Part 2 Minimizing Squared Error to Line. Proof (Part 3) Minimizing Squared Error to Regression Line. Proof (Part 4) Minimizing Squared Error to Regression Line. Regression Line Example. Second Regression Example. R-Squared or Coefficient of Determination. Calculating R-Squared. Covariance and the Regression Line. Correlation and Causality. Chi-Square Distribution Introduction. Pearson's Chi Square Test (Goodness of Fit). Contingency Table Chi-Square Test. ANOVA 1 - Calculating SST (Total Sum of Squares). ANOVA 2 - Calculating SSW and SSB (Total Sum of Squares Within and Between).avi. ANOVA 3 -Hypothesis Test with F-Statistic. Another simulation giving evidence that (n-1) gives us an unbiased estimate of variance. Mean Median and Mode. Range and Mid-range. Reading Pictographs. Reading Bar Graphs. Reading Line Graphs. Reading Pie Graphs (Circle Graphs). Misleading Line Graphs. Stem-and-leaf Plots. Box-and-Whisker Plots. Reading Box-and-Whisker Plots. Statistics: The Average. Statistics: Variance of a Population. Statistics: Sample Variance. Deductive Reasoning 1. Deductive Reasoning 2. Deductive Reasoning 3. Inductive Reasoning 1. Inductive Reasoning 2. Inductive Reasoning 3. Inductive Patterns.

Introduction to statistics. Will eventually cover all of the major topics in a first-year statistics course.

We live in a time of unprecedented access to information. You'll learn how to use statistics to interpret that information and make decisions. San Jose State University

Learn about the frontiers of human health from seven of Stanford's most innovative faculty members. Inspired by a f
This article provides information pertaining to the use of hypnos in the treatment of patients in the emergency departme

An easy to understand, step by step approach to polynomials and factoring

Toplam-Çarpım Sembolleriyle ilgili bilmeniz gereken her şeyi öğreneceksiniz. Eksik hiç bir şey kalmayacak

Curso de Trigonometr

The foundations of Trigonometry from The Khan Academy.
Add to calendar

Trusted paper writing service WriteMyPaper.Today will write the papers of any difficulty.