

Online courses directory (19947)

The foundations of basic probability.
Basic probability. Should have a reasonable grounding in basic algebra before watching. Basic Probability. Example: Marbles from a bag. Example: Picking a non-blue marble. Example: Picking a yellow marble. Term Life Insurance and Death Probability. Probability with Playing Cards and Venn Diagrams. Addition Rule for Probability. Compound Probability of Independent Events. Getting At Least One Heads. Example: Probability of rolling doubles. LeBron Asks: What are the chances of making 10 free throws in a row?. LeBron Asks: What are the chances of three free throws versus one three pointer?. Frequency Probability and Unfair Coins. Example: Getting two questions right on an exam. Example: Rolling even three times. Introduction to dependent probability. Example: Dependent probability. Example: Is an event independent or dependent?. Example: Bag of unfair coins. Monty Hall Problem. Example: All the ways you can flip a coin. Example: Probability through counting outcomes. Permutations. Combinations. Example: Ways to arrange colors. Example: 9 card hands. Example: Ways to pick officers. Getting Exactly Two Heads (Combinatorics). Probability and Combinations (part 2). Probability using Combinations. Exactly Three Heads in Five Flips. Generalizing with Binomial Coefficients (bit advanced). Example: Different ways to pick officers. Example: Combinatorics and probability. Example: Lottery probability. Mega Millions Jackpot Probability. Conditional Probability and Combinations. Birthday Probability Problem. Random Variables. Discrete and continuous random variables. Probability Density Functions. Expected Value: E(X). Binomial Distribution 1. Binomial Distribution 2. Binomial Distribution 3. Binomial Distribution 4. Expected Value of Binomial Distribution. Poisson Process 1. Poisson Process 2. Law of Large Numbers. Introduction to Random Variables. Probability (part 1). Probability (part 2). Probability (part 3). Probability (part 4). Probability (part 5). Probability (part 6). Probability (part 7). Probability (part 8).

This course introduces students to the basic concepts and logic of statistical reasoning and gives the students introductory-level practical ability to choose, generate, and properly interpret appropriate descriptive and inferential methods. In addition, the course helps students gain an appreciation for the diverse applications of statistics and its relevance to their lives and fields of study. The course does not assume any prior knowledge in statistics and its only prerequisite is basic algebra. We offer two versions of statistics, each with a different emphasis: Probability and Statistics and Statistical Reasoning. Each course includes all expository text, simulations, case studies, comprehension tests, interactive learning exercises, and the StatTutor labs. Each course contains all of the instructions for the four statistics packages options we support. To do the activities, you will need your own copy of Microsoft Excel, Minitab, the open source R software, TI calculator, or StatCrunch. One of the main differences between the courses is the path through probability. Probability and Statistics includes the classical treatment of probability as it is in the earlier versions of the OLI Statistics course.

Probability theory captures a number of essential characteristics of human cognition, including aspects of perception, reasoning, belief revision, and learning. Expressions of degree of belief were used in language long before people began codifying the laws of probability theory. This course explores the history and debates over codifying the laws of probability, how probability theory applies to specific cognitive processes, how it relates to the human understanding of causality, and how new computational approaches to causal modeling provide a framework for understanding human probabilistic reasoning.
This class is suitable for advanced undergraduates or graduate students specializing in cognitive science, artificial intelligence, and related fields.
This free online course introduces you to the mathematics of probability, chance and the analysis of data. The course begins by introducing data collection and analysis, graphs and frequency distribution. The course examines chance in the context of gambling, odds and probability. The course is of interest to anybody who needs to analyse mathematical data and is particularly valuable to students studying for exams.

This course covers interpretations of the concept of probability. Topics include basic probability rules; random variables and distribution functions; functions of random variables; and applications to quality control and the reliability assessment of mechanical/electrical components, as well as simple structures and redundant systems. The course also considers elements of statistics; Bayesian methods in engineering; methods for reliability and risk assessment of complex systems (event-tree and fault-tree analysis, common-cause failures, human reliability models); uncertainty propagation in complex systems (Monte Carlo methods, Latin Hypercube Sampling); and an introduction to Markov models. Examples and applications are drawn from nuclear and other industries, waste repositories, and mechanical systems.

This course introduces students to probability and random variables. Topics include distribution functions, binomial, geometric, hypergeometric, and Poisson distributions. The other topics covered are uniform, exponential, normal, gamma and beta distributions; conditional probability; Bayes theorem; joint distributions; Chebyshev inequality; law of large numbers; and central limit theorem.

This class covers quantitative analysis of uncertainty and risk for engineering applications. Fundamentals of probability, random processes, statistics, and decision analysis are covered, along with random variables and vectors, uncertainty propagation, conditional distributions, and second-moment analysis. System reliability is introduced. Other topics covered include Bayesian analysis and risk-based decision, estimation of distribution parameters, hypothesis testing, simple and multiple linear regressions, and Poisson and Markov processes. There is an emphasis placed on real-world applications to engineering problems.

Measures of central tendency and dispersion. Mean, median, mode, variance, and standard deviation. Statistics intro: mean, median and mode. Example: Finding mean, median and mode. Mean median and mode. Exploring Mean and Median Module. Exploring mean and median. Average word problems. Sample mean versus population mean.. Reading Box-and-Whisker Plots. Constructing a box-and-whisker plot. Box-and-Whisker Plots. Creating box and whisker plots. Example: Range and mid-range. Range, Variance and Standard Deviation as Measures of Dispersion. Variance of a population. Sample variance. Review and intuition why we divide by n-1 for the unbiased sample variance. Simulation showing bias in sample variance. Unbiased Estimate of Population Variance. Another simulation giving evidence that (n-1) gives us an unbiased estimate of variance. Simulation providing evidence that (n-1) gives us unbiased estimate. Will it converge towards -1?. Variance. Population standard deviation. Sample standard deviation and bias. Statistics: Standard Deviation. Exploring Standard Deviation 1 Module. Exploring standard deviation 1. Standard deviation. Statistics: Alternate Variance Formulas. Statistics: The Average. Statistics: Variance of a Population. Statistics: Sample Variance. Statistics intro: mean, median and mode. Example: Finding mean, median and mode. Mean median and mode. Exploring Mean and Median Module. Exploring mean and median. Average word problems. Sample mean versus population mean.. Reading Box-and-Whisker Plots. Constructing a box-and-whisker plot. Box-and-Whisker Plots. Creating box and whisker plots. Example: Range and mid-range. Range, Variance and Standard Deviation as Measures of Dispersion. Variance of a population. Sample variance. Review and intuition why we divide by n-1 for the unbiased sample variance. Simulation showing bias in sample variance. Unbiased Estimate of Population Variance. Another simulation giving evidence that (n-1) gives us an unbiased estimate of variance. Simulation providing evidence that (n-1) gives us unbiased estimate. Will it converge towards -1?. Variance. Population standard deviation. Sample standard deviation and bias. Statistics: Standard Deviation. Exploring Standard Deviation 1 Module. Exploring standard deviation 1. Standard deviation. Statistics: Alternate Variance Formulas. Statistics: The Average. Statistics: Variance of a Population. Statistics: Sample Variance.

Introduction to probability. Independent and dependent events. Compound events. Mutual exclusive events. Addition rule for probability. Basic Probability. Probability space exercise example. Probability space. Example: Marbles from a bag. Example: Picking a non-blue marble. Example: Picking a yellow marble. Probability 1. Probability with Playing Cards and Venn Diagrams. Addition Rule for Probability. Compound Probability of Independent Events. Getting At Least One Heads. Example: Probability of rolling doubles. LeBron Asks: What are the chances of making 10 free throws in a row?. LeBron Asks: What are the chances of three free throws versus one three pointer?. Frequency Probability and Unfair Coins. Example: Getting two questions right on an exam. Example: Rolling even three times. Independent probability. Frequency Stability. Introduction to dependent probability. Example: Dependent probability. Example: Is an event independent or dependent?. Example: Bag of unfair coins. Dependent probability. Monty Hall Problem. Intersection and union of sets. Relative complement or difference between sets. Universal set and absolute complement. Subset, strict subset, and superset. Bringing the set operations together. Basic set notation. Probability (part 1). Probability (part 2). Probability (part 3). Probability (part 4). Probability (part 5). Probability (part 6). Probability (part 7). Probability (part 8). Introduction to Random Variables. Basic Probability. Probability space exercise example. Probability space. Example: Marbles from a bag. Example: Picking a non-blue marble. Example: Picking a yellow marble. Probability 1. Probability with Playing Cards and Venn Diagrams. Addition Rule for Probability. Compound Probability of Independent Events. Getting At Least One Heads. Example: Probability of rolling doubles. LeBron Asks: What are the chances of making 10 free throws in a row?. LeBron Asks: What are the chances of three free throws versus one three pointer?. Frequency Probability and Unfair Coins. Example: Getting two questions right on an exam. Example: Rolling even three times. Independent probability. Frequency Stability. Introduction to dependent probability. Example: Dependent probability. Example: Is an event independent or dependent?. Example: Bag of unfair coins. Dependent probability. Monty Hall Problem. Intersection and union of sets. Relative complement or difference between sets. Universal set and absolute complement. Subset, strict subset, and superset. Bringing the set operations together. Basic set notation. Probability (part 1). Probability (part 2). Probability (part 3). Probability (part 4). Probability (part 5). Probability (part 6). Probability (part 7). Probability (part 8). Introduction to Random Variables.
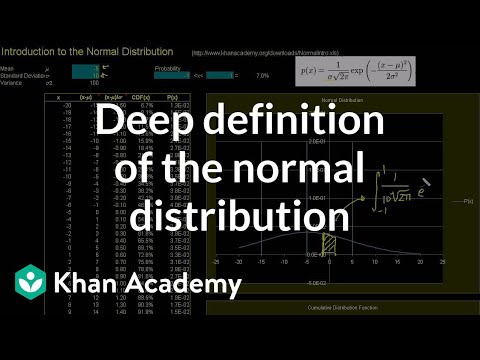
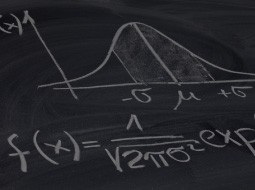
Making inferences based on sample data. Confidence intervals. Margin of error. Hypothesis testing. Introduction to the Normal Distribution. Normal Distribution Excel Exercise. ck12.org Normal Distribution Problems: Qualitative sense of normal distributions. ck12.org Normal Distribution Problems: Empirical Rule. ck12.org Normal Distribution Problems: z-score. ck12.org Exercise: Standard Normal Distribution and the Empirical Rule. Empirical rule. ck12.org: More Empirical Rule and Z-score practice. Z scores 1. Z scores 2. Z scores 3. Central Limit Theorem. Sampling Distribution of the Sample Mean. Sampling Distribution of the Sample Mean 2. Standard Error of the Mean. Sampling Distribution Example Problem. Confidence Interval 1. Confidence Interval Example. Small Sample Size Confidence Intervals. Mean and Variance of Bernoulli Distribution Example. Bernoulli Distribution Mean and Variance Formulas. Margin of Error 1. Margin of Error 2. Hypothesis Testing and P-values. One-Tailed and Two-Tailed Tests. Type 1 Errors. Z-statistics vs. T-statistics. Small Sample Hypothesis Test. T-Statistic Confidence Interval. Large Sample Proportion Hypothesis Testing. Variance of Differences of Random Variables. Difference of Sample Means Distribution. Confidence Interval of Difference of Means. Clarification of Confidence Interval of Difference of Means. Hypothesis Test for Difference of Means. Comparing Population Proportions 1. Comparing Population Proportions 2. Hypothesis Test Comparing Population Proportions. Chi-Square Distribution Introduction. Pearson's Chi Square Test (Goodness of Fit). Contingency Table Chi-Square Test. ANOVA 1 - Calculating SST (Total Sum of Squares). ANOVA 2 - Calculating SSW and SSB (Total Sum of Squares Within and Between).avi. ANOVA 3 -Hypothesis Test with F-Statistic. Introduction to the Normal Distribution. Normal Distribution Excel Exercise. ck12.org Normal Distribution Problems: Qualitative sense of normal distributions. ck12.org Normal Distribution Problems: Empirical Rule. ck12.org Normal Distribution Problems: z-score. ck12.org Exercise: Standard Normal Distribution and the Empirical Rule. Empirical rule. ck12.org: More Empirical Rule and Z-score practice. Z scores 1. Z scores 2. Z scores 3. Central Limit Theorem. Sampling Distribution of the Sample Mean. Sampling Distribution of the Sample Mean 2. Standard Error of the Mean. Sampling Distribution Example Problem. Confidence Interval 1. Confidence Interval Example. Small Sample Size Confidence Intervals. Mean and Variance of Bernoulli Distribution Example. Bernoulli Distribution Mean and Variance Formulas. Margin of Error 1. Margin of Error 2. Hypothesis Testing and P-values. One-Tailed and Two-Tailed Tests. Type 1 Errors. Z-statistics vs. T-statistics. Small Sample Hypothesis Test. T-Statistic Confidence Interval. Large Sample Proportion Hypothesis Testing. Variance of Differences of Random Variables. Difference of Sample Means Distribution. Confidence Interval of Difference of Means. Clarification of Confidence Interval of Difference of Means. Hypothesis Test for Difference of Means. Comparing Population Proportions 1. Comparing Population Proportions 2. Hypothesis Test Comparing Population Proportions. Chi-Square Distribution Introduction. Pearson's Chi Square Test (Goodness of Fit). Contingency Table Chi-Square Test. ANOVA 1 - Calculating SST (Total Sum of Squares). ANOVA 2 - Calculating SSW and SSB (Total Sum of Squares Within and Between).avi. ANOVA 3 -Hypothesis Test with F-Statistic.
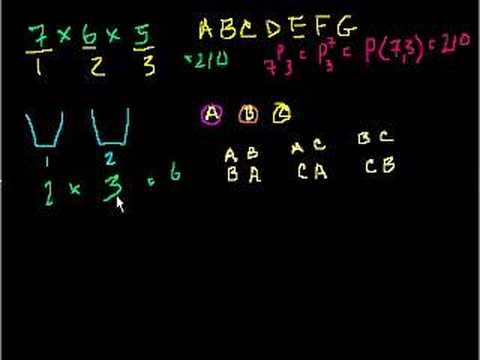
Permutations and combinations. Using combinatorics to solve questions in probability. Permutations. Combinations. Counting 2. Example: Ways to arrange colors. Example: 9 card hands. Example: Ways to pick officers. Permutations. Combinations. Permutations and combinations. Example: Probability through counting outcomes. Example: All the ways you can flip a coin. Getting Exactly Two Heads (Combinatorics). Probability and Combinations (part 2). Probability using Combinations. Exactly Three Heads in Five Flips. Example: Different ways to pick officers. Example: Combinatorics and probability. Example: Lottery probability. Mega Millions Jackpot Probability. Generalizing with Binomial Coefficients (bit advanced). Conditional Probability and Combinations. Conditional Probability (Bayes Theorem) Visualized. Birthday Probability Problem. Probability with permutations and combinations. Permutations. Combinations. Counting 2. Example: Ways to arrange colors. Example: 9 card hands. Example: Ways to pick officers. Permutations. Combinations. Permutations and combinations. Example: Probability through counting outcomes. Example: All the ways you can flip a coin. Getting Exactly Two Heads (Combinatorics). Probability and Combinations (part 2). Probability using Combinations. Exactly Three Heads in Five Flips. Example: Different ways to pick officers. Example: Combinatorics and probability. Example: Lottery probability. Mega Millions Jackpot Probability. Generalizing with Binomial Coefficients (bit advanced). Conditional Probability and Combinations. Conditional Probability (Bayes Theorem) Visualized. Birthday Probability Problem. Probability with permutations and combinations.
Random variables. Expected value. Probability distributions (both discrete and continuous). Binomial distribution. Poisson processes. Random Variables. Discrete and continuous random variables. Probability Density Functions. Expected Value: E(X). Expected value. Law of Large Numbers. Term Life Insurance and Death Probability. Binomial Distribution 1. Binomial Distribution 2. Binomial Distribution 3. Binomial Distribution 4. Expected Value of Binomial Distribution. Galton Board Exploration. Poisson Process 1. Poisson Process 2. Random Variables. Discrete and continuous random variables. Probability Density Functions. Expected Value: E(X). Expected value. Law of Large Numbers. Term Life Insurance and Death Probability. Binomial Distribution 1. Binomial Distribution 2. Binomial Distribution 3. Binomial Distribution 4. Expected Value of Binomial Distribution. Galton Board Exploration. Poisson Process 1. Poisson Process 2.
Fitting a line to points. Linear regression. R-squared. Correlation and Causality. Fitting a Line to Data. Estimating the line of best fit exercise. Estimating the line of best fit. Squared Error of Regression Line. Proof (Part 1) Minimizing Squared Error to Regression Line. Proof Part 2 Minimizing Squared Error to Line. Proof (Part 3) Minimizing Squared Error to Regression Line. Proof (Part 4) Minimizing Squared Error to Regression Line. Regression Line Example. Second Regression Example. R-Squared or Coefficient of Determination. Calculating R-Squared. Covariance and the Regression Line. Correlation and Causality. Fitting a Line to Data. Estimating the line of best fit exercise. Estimating the line of best fit. Squared Error of Regression Line. Proof (Part 1) Minimizing Squared Error to Regression Line. Proof Part 2 Minimizing Squared Error to Line. Proof (Part 3) Minimizing Squared Error to Regression Line. Proof (Part 4) Minimizing Squared Error to Regression Line. Regression Line Example. Second Regression Example. R-Squared or Coefficient of Determination. Calculating R-Squared. Covariance and the Regression Line.

This course lays a strong foundation of concepts to compute and interpret theoretical and experimental probabilities.

Our capacity to collect and store data has exponentially increased, but deriving information from data from a scientific perspective requires a foundational knowledge of probability.
Are you interested in a career in the emerging data science field, or as an actuarial scientist? Or want better to understand statistical theory and mathematical modeling?
In this statistics and data analysis course, we will provide an introduction to mathematical probability to help meet your career goals in the exciting new areas becoming known as information science.
In this course, we will first introduce basic probability concepts and rules, including Bayes theorem, probability mass functions and CDFs, joint distributions and expected values.
Then we will discuss a few important probability distribution models with discrete random variables, including Bernoulli and Binomial distributions, Geometric distribution, Negative Binomial distribution, Poisson distribution, Hypergeometric distribution and discrete uniform distribution.
To continue learning about probability, enroll in Probability: Distribution Models & Continuous Random Variables, which covers continuous distribution models, central limit theorem and more.

The Center for Science of Information, a National Science Foundation Center, supports learners by offering free educational resources in information science.

In this statistics and data analysis course, you will learn about continuous random variables and some of the most frequently used probability distribution models including, exponential distribution, Gamma distribution, Beta distribution, and most importantly, normal distribution.
You will learn how these distributions can be connected with the Normal distribution by Central limit theorem (CLT). We will discuss Markov and Chebyshev inequalities, order statistics, moment generating functions and transformation of random variables.
This course along with the recommended pre-requisite, Probability: Basic Concepts & Discrete Random Variables, will you give the skills and knowledge to progress towards an exciting career in information and data science.
The Center for Science of Information, a National Science Foundation Center, supports learners by offering free educational resources in information science.

Learn How to Get GREAT Deals - With LITTLE Competition - Using This Hidden Source of EXTREMELY Motivated Sellers!

How big is the problem? And how large is the opportunity to solve it? Mir Imran, parallel entrepreneur and CEO of InCube

What do you do when you encounter a problem? This self-paced career development course will help you think critically and creatively to solve problems and design solutions. These skills will set you apart from peers and make you a sought-after leader and teammate.
This is the third course in Fullbridge’s four-part Career Development XSeries, designed to prepare you to succeed in the modern workplace.
Add to calendar

Trusted paper writing service WriteMyPaper.Today will write the papers of any difficulty.